Spring Warbler Survey
About the Survey |
Study Areas |
Data and Statistical Methods |
General Findings |
Individual Species Information |
Annual Reports |
About the SurveyTop
The Spring Warbler Count ceased to be an active project as of 2007.
The study was aimed principally at participants who could easily visit a park or wooded area near their home each morning before going to work but who may not have been able to commit to extended periods of time at an established migration station.
Study AreasTop
The Plot
For your study plot, pick a wooded area which you can conveniently visit on most mornings between May 1 and June 5 both inclusive. Establish a route through the plot.
Visits
Visit your plot each morning and spend one hour counting and listing the species listed on the input form. If you are sure that you know the bird's song you can count it even if you do not see it. It is a good idea to go over your warbler song tape or CD to review the songs. Remember that you are counting birds - do not try to estimate the number of birds on your plot!
Follow the same route through your plot each day. You can get someone else to do the count on mornings when you cannot make it. Just be sure that the person knows the birds! Two people can share one plot as long as they cover the area using the same route. Note which trip is done by which observer by entering an initial where it is indicated on the input form. Do not count together or combine two lists.
Recording Data
You may wish to enter your notes in a field book and transfer them to the recording sheet later. Reports of any warblers not in the form can be listed below or on a separate sheet.
Write a short description of your plot including the location and the boundaries in case someone else should wish to use the same area in future years when you are not available.
On days when you do not visit your plot, leave the report form blank with a visit count of '0'. If you visit the plot but see no birds, put a '1' in the visit column and leave the rest of the column blank.
Send in the Data
Email your completed input form with any addition documentation to the Warbler Survey coordinator before the end of June.
Currently active study areas are:
- Brookbank Ravine
- Cedarvale Ravine
- High Park
- Moore Park
- Mount Pleasant Cemetery
- Unwin Avenue
- Wychwood Park
If you would like to add an area or particpate in a current area please
to the organiser.Data and Statistical MethodsTop
Database
Excel spreadsheets exist for all Toronto sites for all years except 1984 and 1985 when data was not collected. All spreadsheet data has been entered into an Access database. The database currently has 39,519 records: 864 records for each year comprising a record for each of the 24 birds (21 Warblers and 3 additional species) for each of the 36 days. This is summary data combining information from all Toronto sites for the year.
Chi Square Test
The Chi Square test uses the null hypothesis that the “observed numbers for this bird are not changing over time”. The average number of this bird counted across the years is used as the expected value for each year. Observed values for each year are subtracted from this expected value and the difference squared. The resulting values are added up across all years. The result is observed Chi Square.
Expected Chi Square is a table look up using degrees of freedom equal to one less than the number of years of observing and a confidence interval of 0.005 (which gives us a two-tailed, 99% degree of confidence). If expected Chi Square is less than observed, we reject the null hypothesis and conclude that the observed numbers are significantly changing over the years. The appearance of the graph tells whether the change is up or down.
Kendall Rank
Correlation
Kendall’s Rank Correlation allows comparisons of the ordering of two lists of items. The Correlation gives a number (called Tau) between –1 and 1. If two lists are in exactly the same order from top to bottom, then Tau is 1; if one list is exactly the reverse order of the other, then Tau is –1. A Tau of 0 means that the lists are unrelated in order. The higher the value of Tau, the more closely the two lists are matched in ordering.
General FindingsTop
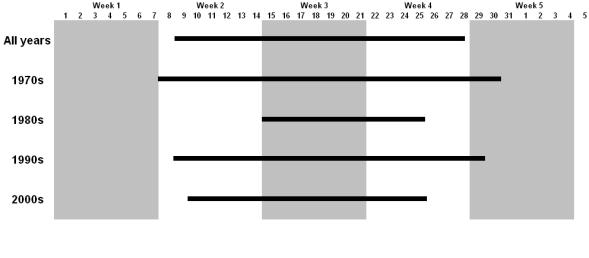
Based on data for all birds for all years of the count, the best time to see warblers is the 3rd week in May.
The size of the migration is nearly the same as it was in 1970 but it has fluctuated widely over the years.
A rolling 4-year average of the values suggests a possible 17-year cycle in migration size.
But similar graphs for individual birds do not support the cycle idea.
The migration timing has not been moving earlier due to global warming. (The dark lines mark days in which the total Birds Per Visit exceeded 100 birds.)
The relative abundance of birds has changed dramatically since the 1970s. Then the relative abundance graph looked like this.
(The commonest bird is assigned the value of 100 and all other birds have values calculated relative to their numbers as compared to the commonest bird.)
Whereas now it looks like this.
Abundance Ordering is the order of the birds in terms of how common they are. The ordering of the birds has not changed significantly over the years.
(In the graph, “1980/70” means the 1980s list order compared to the 1970s list order.)
The numbers of birds reported on the Survey are changing.
Birds with rising trend
These rising trends are significant at the 99% level.
% | Annual Change in | |
|---|---|---|
Palm Warbler | 408 | +5.4 |
Yellow-rumped Warbler | 120 | +31.3 |
Birds with falling trend
These falling trends are significant at the 99% level.
% | Annual Change in | |
|---|---|---|
Canada Warbler | 84 | -14.1 |
Rose-breasted Grosbeak | 60 | -27.9 |
Black-and-white Warbler | 45 | -10.4 |
Blackburnian Warbler | 49 | -10.4 |
Birds to keep an eye on
These falling trends are significant only at the 90% level, not at the 99% level . There is reason for being cautious about whether the falling trends are real or not.
% | Annual Change in | |
|---|---|---|
Scarlet Tanager | 58 | -7.1 |
Tennessee Warbler | 57 | -18.5 |
Bay-breasted Warbler | 54 | -12.0 |
Swainson’s Thrush | 47 | -18.4 |
Black-throated Green Warbler | 39 | -10.3 |
Cape May Warbler | 6 | -0.4 |
Birds with unchanged trends
These birds show no statistically significant trend either up or down.
American Redstart | Blackpoll Warbler | Black-throated Blue Warbler |
Chestnut-sided Warbler | Common Yellowthroat | Magnolia Warbler |
Nashville Warbler | Ovenbird | Wilson’s Warbler |
Yellow Warbler |
Individual Species InformationTop
Tennessee Warbler Back
Falling trend significant at the 90% but not at the 99% degree of confidence.
Nashville Warbler Back
Falling trend significant at the 90% but not at the 99% degree of confidence.
Blackburnian WarblerBack
Falling trend significant at the 90% but not at the 99% degree of confidence.
Yellow-rumped Warbler Back
Falling trend significant at the 90% but not at the 99% degree of confidence.
Black-and-White Warbler Back
No significant trend either up or down.
Swainson's ThrushBack
Falling trend significant at the 90% but not at the 99% degree of confidence.
Rose-breasted Grosbeak Back
Falling trend significant at the 99% degree of confidence.